


Surveillance data is a technology story as much as a medical one: cases are detected, confirmed, counted and published, and the pattern they form tells officials where to act. This week the pattern moved. US measles cases grew by 8 percent in seven days to a total of 4,410. This article looks at the drivers behind that rise, the symptoms clinicians use to flag cases for testing and the vaccination guidance that the data support, keeping the framing cautious and factual throughout, because with outbreak data, precision about what numbers mean matters as much as the numbers themselves.
Reading the 8 percent figure correctly
A weekly rise of 8 percent sounds dramatic, and it deserves scrutiny rather than either panic or dismissal. Percentage rises are largest when clusters are first detected in under-vaccinated communities: one school or neighbourhood outbreak can add dozens of linked cases to the national count in a single reporting cycle. Officials also note that better detection inflates counts in a useful way, because a found case can be isolated and contacts traced. The underlying driver, consistently reported, is coverage gaps. Where MMR uptake has fallen below the roughly 95 percent level needed for community protection, an imported case finds susceptible contacts quickly, and the surveillance system records the result a week or two later.
The clinical signals that feed the system
Cases enter the data through a recognisable clinical picture: high fever, cough, coryza and conjunctivitis, followed by a spreading rash, sometimes with the small white Koplik spots inside the mouth that are distinctive to measles. Laboratory confirmation then separates measles from lookalike rashes. Understanding that pipeline helps readers interpret weekly totals: they lag real infections, they cluster where testing intensifies and they reflect reporting speed as well as spread. Our technology coverage applies the same data literacy elsewhere, for instance in explaining what an early vaccine study can and cannot show.
The response system behind the numbers also deserves a technical note. When a case is confirmed, laboratories sequence samples where possible, helping officials distinguish separate importations from one spreading chain and map how clusters connect. Exposure notifications increasingly run through digital channels, venue alerts, school messaging systems and health department dashboards, which is one reason detection now surfaces in weekly counts faster than in past decades. That speed cuts both ways for interpretation: a sharp weekly rise can partly reflect a backlog being cleared or a testing push in one county, not only new infections. Analysts therefore read the total alongside hospitalisation figures, the number of separate clusters and the share of cases with unknown sources, which is the best single indicator of whether transmission is escaping tracing. For the current total of 4,410, officials describe most cases as linked to known clusters, a technically reassuring pattern even as the headline grows. Readers following the data week by week should adopt the same dashboard habit: never read one metric alone when the system publishes four.
Vaccination: the intervention the data endorse
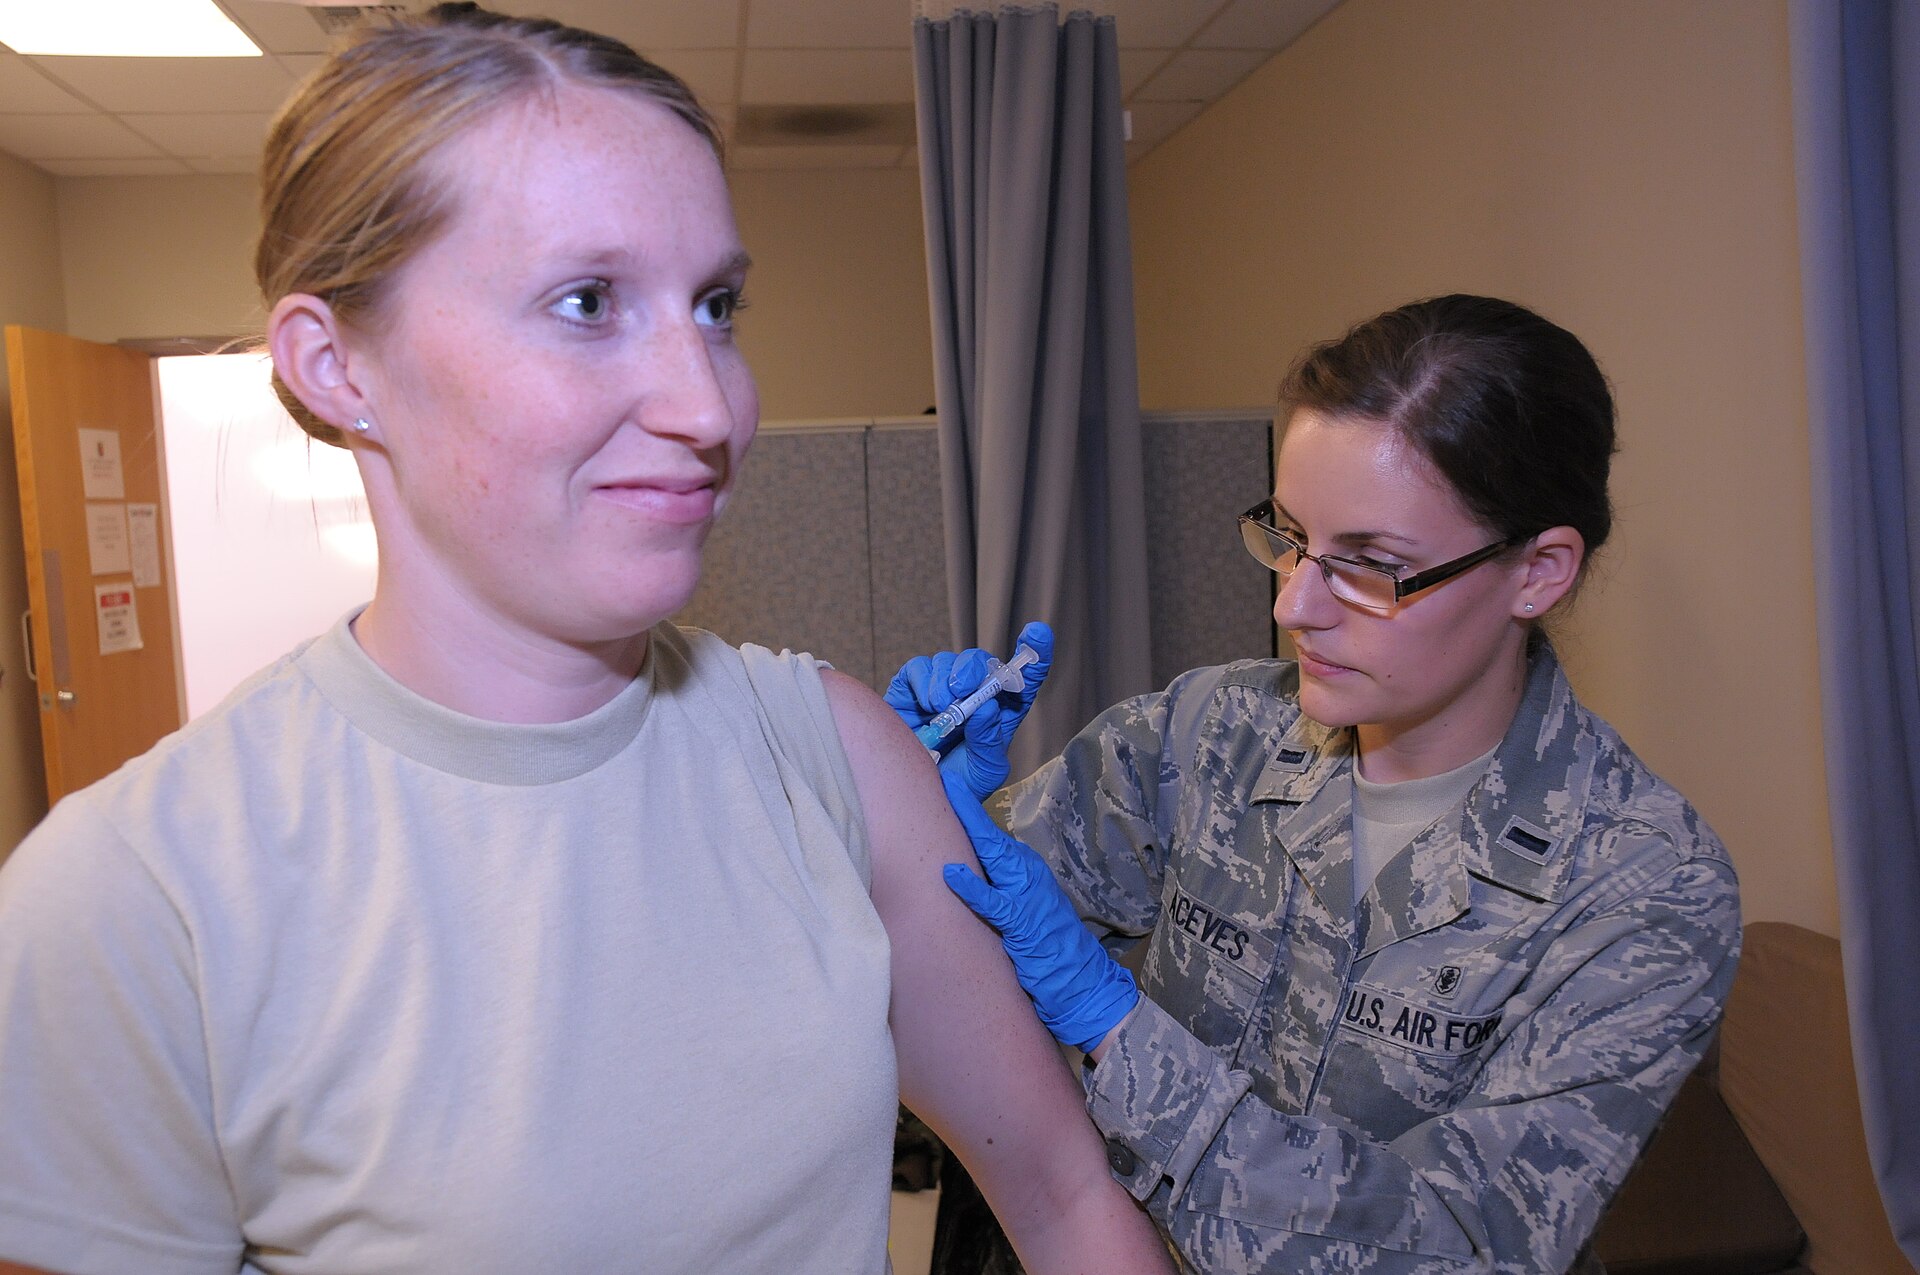
Whatever the weekly percentage, the recommended response has not changed, because the vaccine’s performance is among the best measured in medicine. Two MMR doses prevent measles in about 97 percent of recipients. Officials advise checking records, catching up missed doses and following exposure guidance promptly, since post-exposure vaccination within a short window can still help. The reference source for symptoms, exposure steps and travel advice is the CDC measles pages. For infants too young to be vaccinated and people with weakened immune systems, community coverage is the protective technology, and current clusters show where it has worn thin.
What to watch in next week’s data
Analysts will watch whether new cases keep appearing in the same clusters, which suggests ongoing transmission, or tail off, which suggests containment is working. They will also watch the geography: spread into new counties matters more than growth inside a known outbreak. For readers, the disciplined habit is to read the total, 4,410 and rising, alongside those qualifiers. Measles data reward exactly the approach this site takes to any fast-moving story: respect the numbers, understand the system producing them, and act on the guidance, vaccination checks and early symptom recognition, that the evidence consistently supports.
